1.Experimental purpose
(1) Determine the content of main salt metal ions in Ni and Cu plating solutions by Titration;
(2) Determine the content of main salt metal ions in Ni and Cu plating solutions by X-ray Fluorescence Spectrometer;
(3) Compare the main salt ion content determined by two methods and their errors between them to assess XRF instrument accuracy;
(4) Perform spiking of the plating solution, determine the recovery of adding standard by using two different methods, and compare the results.
2. Experimental Methods
(1)Preparation of plating solution:
Plating Ni solution: Choose an ordinary Ni plating solution formula. Begin by pre-drying nickel sulfate hexahydrate to nickel sulfate. Weigh out 80g of nickel sulfate (NiSO4), 4g of sodium chloride (NaCl), 33g of boric acid (H3BO3), 30g of sodium Sulfate (Na2SO4), and 0.05g of sodium dodecyl sulfate (C12H25SO4Na). Next, dissolve each component in hot water, mix them in a container, and then dilute the mixture with water to the required volume. Finally, clarify the plating solution again using either the siphon or filtration method, add the dissolved sodium dodecyl sulfate solution, stir well, and prepare another 1000mL of solution for sampling and analysis.
Plating Cu solution: Choose an ordinary Cu plating solution formula. Begin by pre-drying copper sulfate hydrate to cupric sulfate and weighing 50g of CuSO4. Next, dissolve the measured cupric sulfate in two-thirds of the warm water volume. Once the cupric sulfate has fully dissolved and the solution has cooled, gradually add 40mL of sulfuric acid (H2SO4) while continuously stirring (note: this may cause an exothermic reaction). This will create a 1000mL solution, which should be allowed to settle and filter. Finally, take a sample of the plating solution for analysis.
(2)Preparation and calibration of EDTA standard solution:
Preparation of 0.05M EDTA solution: Weigh 20g of Ethylenediaminetetraacetic acid disodium salt dissolved in 1L of distilled water and shaken well.
Calibration of EDTA standard solution: Weigh 1g of standard zinc oxide (accurate to 0.2mg) heated to a constant weight at 800°C, moistened with distilled water, add HCL solution (1:1) until the sample is dissolved, transfer to a 250ml volumetric flask, dilute to the scale and shake well. Take 20.00ml of the above solution, add 80ml water, neutralize with 10% ammonia until pH is 7-8. Add 5ml ammonia-ammonium chloride buffer solution and five drops of 0.5% chromium black T indicator. Titrate with 0.05M EDTA until the color changes from violet to pure orchid.
(3)Analysis of solution:
Titration Method (TM)
To determine the Ni2+ content, start by using a pipette to absorb 10ml of solution and placing it into a 100ml volumetric flask. Add water to the flask until it reaches the scale, then shake well. Next, absorb 10 ml of diluent and place it in a 250ml conical flask. Add 1g of potassium fluoride and shake until it's dissolved, then add 30ml of water. The solution should now be turbid, generating a tiny amount of magnesium fluoride precipitate. Add 10ml of pH=10 buffer and a small amount of murexide indicator. Titrate with 0.05M EDTA solution from yellow to violet-red as the endpoint, and record the titration results in Table 1-1.
To determine the Cu2+ content, start by using a pipette to absorb 2ml of plating solution and placing it into a 500ml conical flask. Next, add eight drops of hydrogen peroxide and 50ml of water. Boil the mixture for a short and allow it to cool. Add 150ml of water, 1g of ammonium fluoride, and six drops of triethanolamine. The solution should turn light blue upon adding ammonia. Add 10 to 12 drops of PAN and titrate the solution with a 0.050M EDTA solution until the endpoint changes to green. Record the titration results in Table 1-2.
X-Ray fluorescence spectroscopy Method (XRF)
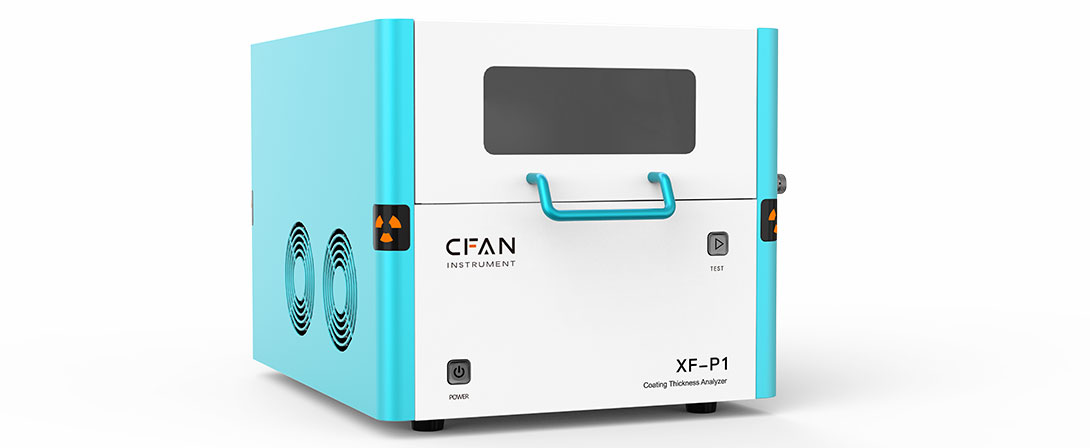
The experiment is based on the CFAN instrument P1 coating thickness analyzer, which can support the coating thickness detection, component analysis, and ion concentration analysis. It employs the Intelligent Fundamental Parameters and uses a customized liquid test cup.
For each group of plating solution, take a portion of the sample and determine the ions in the solution with the help of XRF fluorescence spectrometer. Each group of samples undergoes three separate tests. The detection results for the Ni and Cu plating solutions are recorded in Table 1-3 and Table 1-4, respectively.
Table 1-1 Titration data of Ni2+ in acid Ni plating solution before spiking
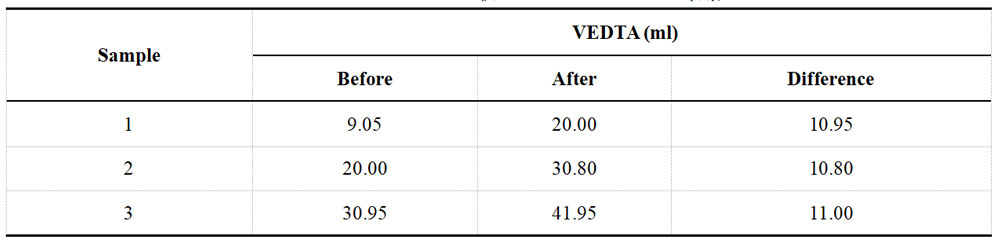
Table 1-2 Titration data of Cu2+ in acid Cu plating solution before spiking
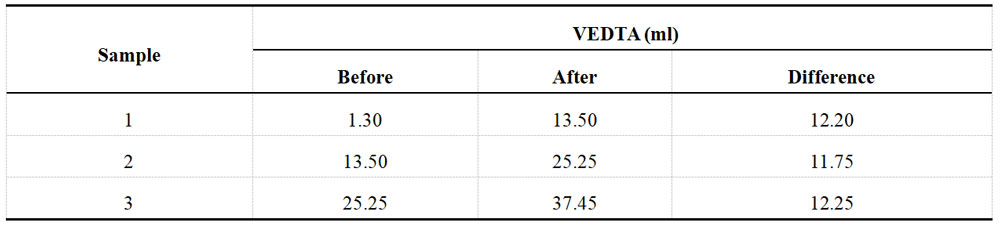
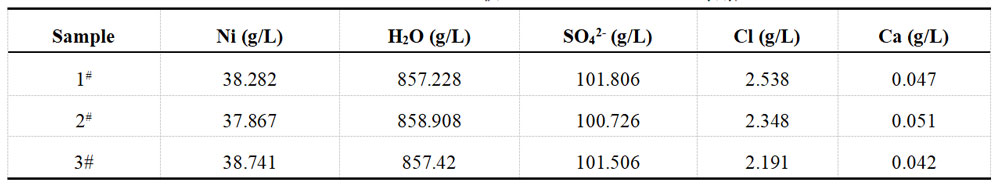
Table 1-3 Determination data of acid Ni plating solution from XRF before spiking
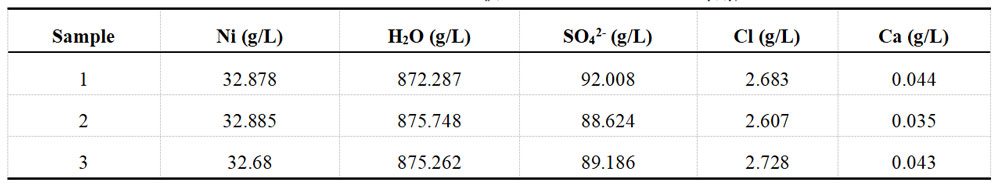
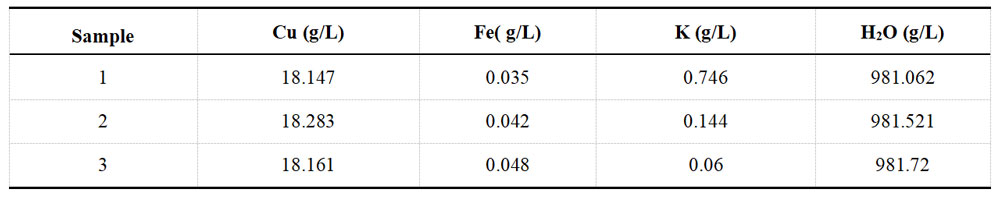
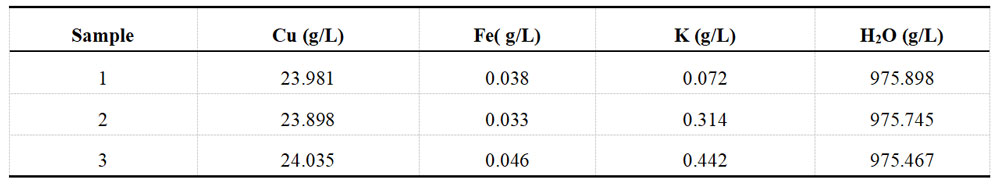
Table 1-4 Determination data of acid Cu plating solution from XRF before spiking
(4)Spike-and-Recovery:
The concentration of nickel sulfate in the plating solution was measured before and after spiking, resulting in 100 g/L and 115 g/L, respectively. The spiked amount of nickel sulfate was 15 g/L, equivalent to adding 5.691 g/L of Ni2+. The results of the subsequent titration with 0.05M EDTA solution can be found in Table 1-5, while the XRF test results are available in Table 1-6.
Table 1-5 Titration of Ni2+ in acid Ni plating solution after spiking
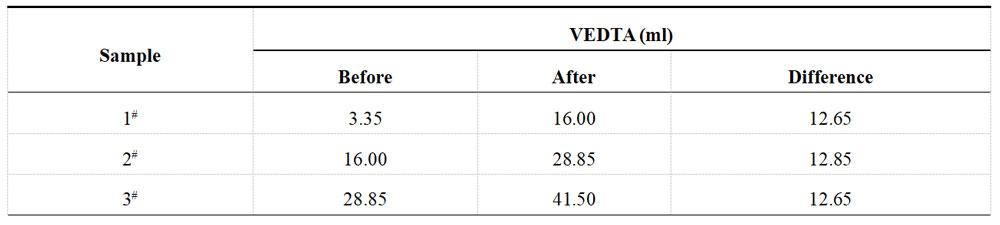
Table 1-6 Determination data of acid Ni plating solution from XRF after spiking
The concentration of cupric sulfate in the plating solution was measured before and after spiking, resulting in concentrations of 50 g/L and 65 g/L, respectively. The amount of cupric sulfate added was 15 g/L, equivalent to 5.971 g/L of Cu2+. These results were then re-titrated using a 0.05M EDTA solution, and the findings are presented in Table 1-7. Additionally, Table 1-8 displays the XRF test results.
Table 1-7 Titration of Cu2+ in acid Cu plating solution after spiking
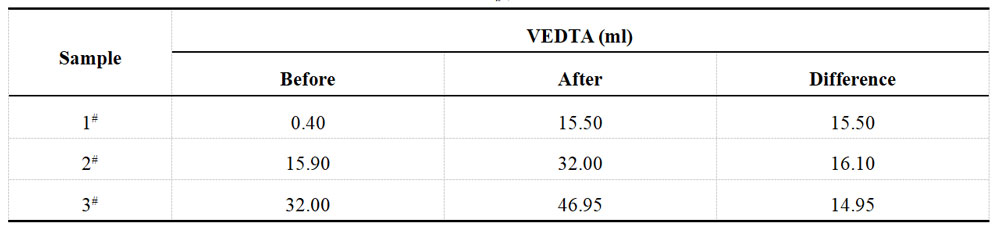
Table 1-8 Determination data of acid Cu plating solution from XRF after spiking
3. Data Calculation
(1)Determination of ion content by titration
Calculation formula for Ni ion contents:

Formula: M-- the molar concentrations of the standard EDTA solution;
V-- ml of standard EDTA solution consumed.
Calculation formula for Cu ion contents:

Formula: N-- gram-equivalent number of the standard EDTA solution;
V-- ml of standard EDTA solution consumed.
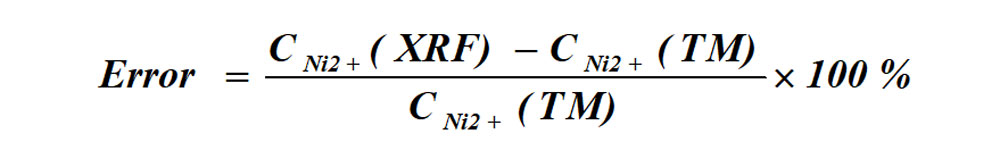
(2)Determination errors of XRF and titration method
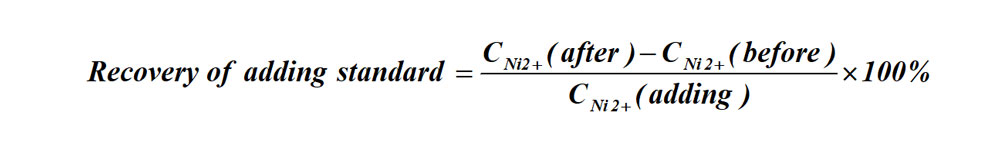
(3)Recovery of adding standard
All calculated data are recorded centrally in Tables 2-1 and 2-2 of the data cards.
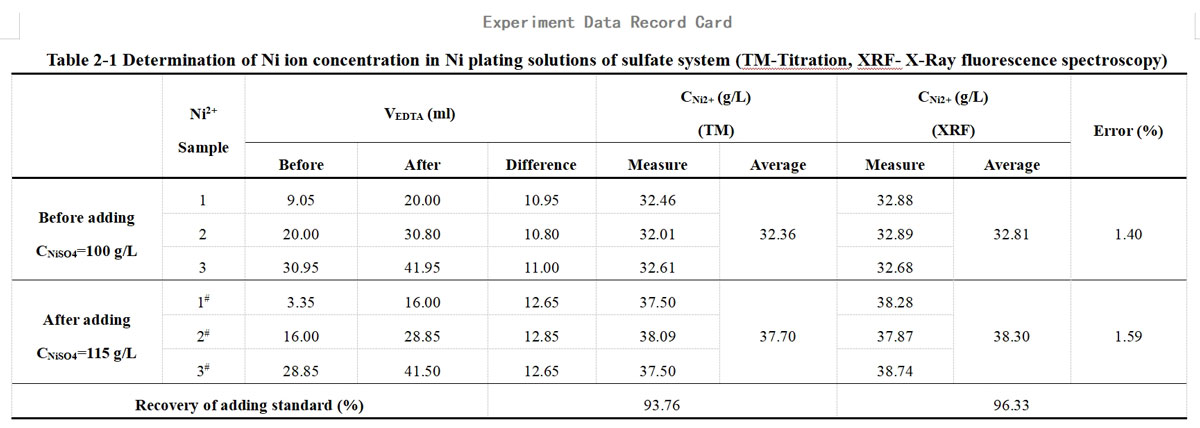
This experiment used a traditional acidic nickel plating solution, mainly consisting of nickel sulfate and boric acid. The nickel sulfate content in the plating solution before and after adding the standard was 100 g/L and 115 g/L, respectively (dried, without water of crystallization). The amount of nickel sulfate added was 15 g/L, equivalent to the addition of Ni2+ of 5.691 g/L.
In the titration of Ni2+</sup>, the standard solution used was 0.050M EDTA solution, calibrated and measured to have an actual concentration of 0.0505 mol/L.
The formula for the determination of Ni ion content by titration:
The formula for the determination of Ni ion content by titration:
Formula: M-- the molar concentrations of the standard EDTA solution;
V-- ml of standard EDTA solution consumed.
The formula for the error between XRF instruments and the titration method of determination:
The formula for the recovery of adding standard:
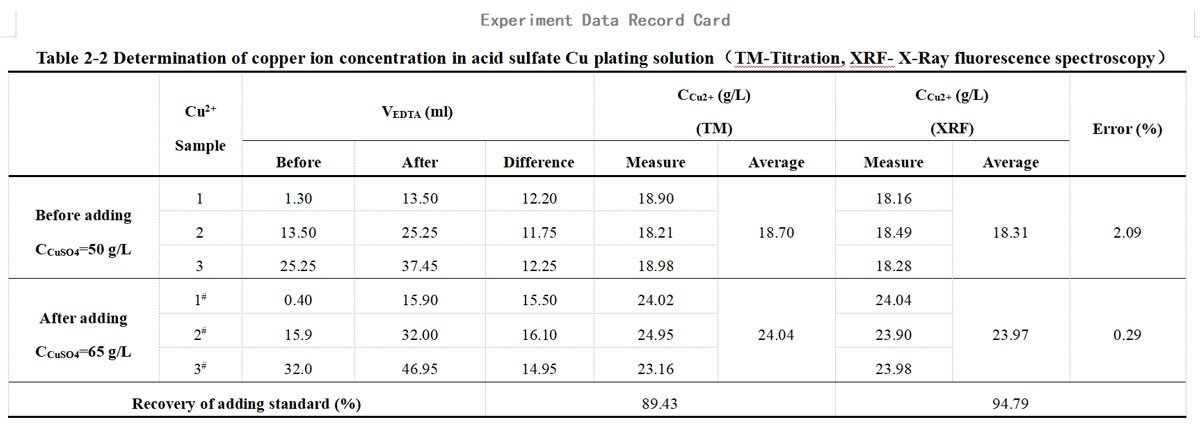
For this experiment, a traditional acid Cu sulfate solution (the main components are cupric sulfate and sulfuric acid) was chosen for the Cu plating solution, and the content of cupric sulfate (dried, without water of crystallization) in the plating solution before and after spiking was 50 g/L and 65 g/L. The spiked amount of cupric sulfate was 15 g/L, equivalent to adding 5.971 g/L of Cu2+.
In the titration of Cu2+, the standard solution used was 0.050M EDTA solution, calibrated and measured to have an actual concentration of 0.0488 mol/L.
The formula for the determination of Cu ion content by titration:
Formula: N-- gram-equivalent number of the standard EDTA solution;
V-- ml of standard EDTA solution consumed.
The formula for the error between XRF instruments and the titration method of determination:
The formula for the recovery of adding standard:
4. Experimental results analysis
As shown in the results in Table 2-1 and Table 2-2:
(1)The comparison between the test results of the titration method and XRF, the error of the two methods is in the range of 0.29~2.09%.
(2)The recovery of the adding standard obtained by XRF is closer to 100% than that calculated by titration. This is mainly because the titration method is less effective than XRF and prone to reading errors, experimental operation errors, and individual errors in judgment of the titration endpoint.
(3)The measured ion content {CM2+(before)、CM2+(after)} is lower than the theoretical value due to incomplete drying or easy absorption of moisture after drying. However, the theoretically calculated CM2+(adding) remains unchanged. As a result, the calculated recovery of the adding standard is low and does not exceed 100%. It's worth noting that this factor does not affect the comparison between the titration and XRF methods since the same sample is used for both.
Using the data results from Table 2-1 and Table 2-2, a comparative analysis chart is shown in Figure 1.
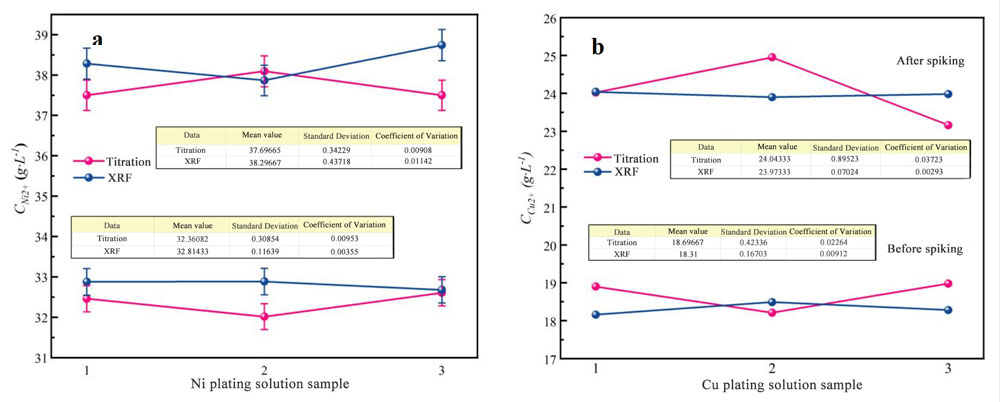
Figure 1 The comparison chart of titration and XRF test results before and after spiking.
(a.Plating Ni solution,b. Plating Cu solution)
As shown in Figure 1, the mean value demonstrates the ion content obtained through various methods. Additionally, the standard deviation reflects the test stability of each data sample, while the coefficient of variation (calculated as the standard deviation divided by the mean value) represents the level of test error based on the sample ontology.
Figure 1 clearly illustrates that when determining ion content through titration, the test results exhibit greater fluctuations than the XRF method (i.e., the relatively larger standard deviation for titration). This is because of factors such as differences in solution preparation, measurement errors, and operator variations. In contrast, the XRF method is much simpler to operate, making it a more effective choice for determining ion content than titration.

