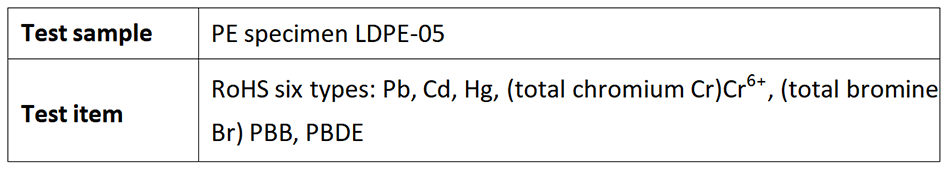
--- A brief Introduction to the advantages of the FP Algorithm in RoHS Testing
Domestic marketing of RoHS testing instruments, the majority of the current domestic manufacturers are still using the Influence Coefficients Method in testing, while imported companies such as SHIMADZU and HITACHI are basically using the FP method (Fundamental Parameters method) in testing.
Both methods can meet the general testing needs, but FP method in the detection speed and testing complex samples have obvious superiority, the comparison of two XRF products of our T6 (Influence Coefficients Method ) and T7 (FP method) for the following sample analysis:
1. Comparison of test efficiency and reproducibility
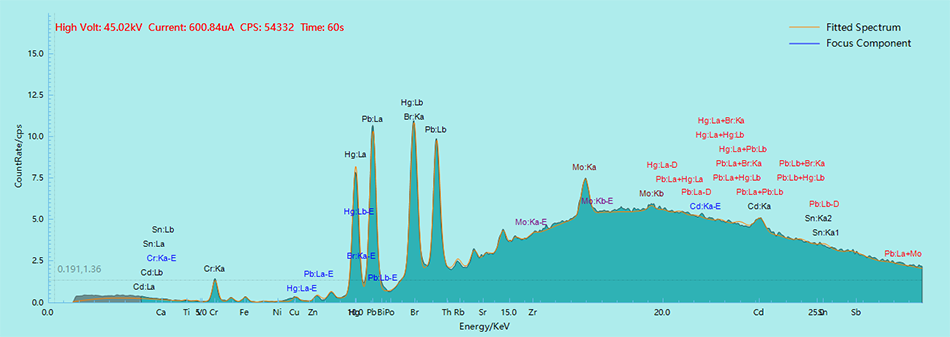
1.1 T7 (FP method) test efficiency and reproducibility: (60 seconds/sample)
Data from five test results:
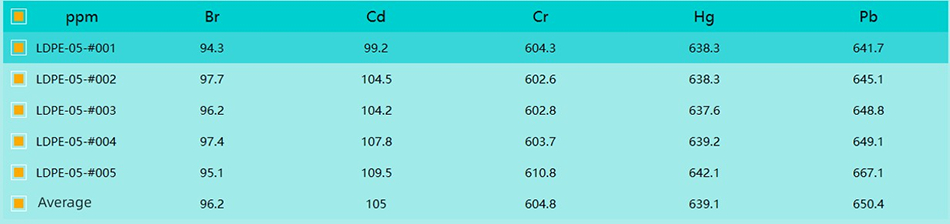
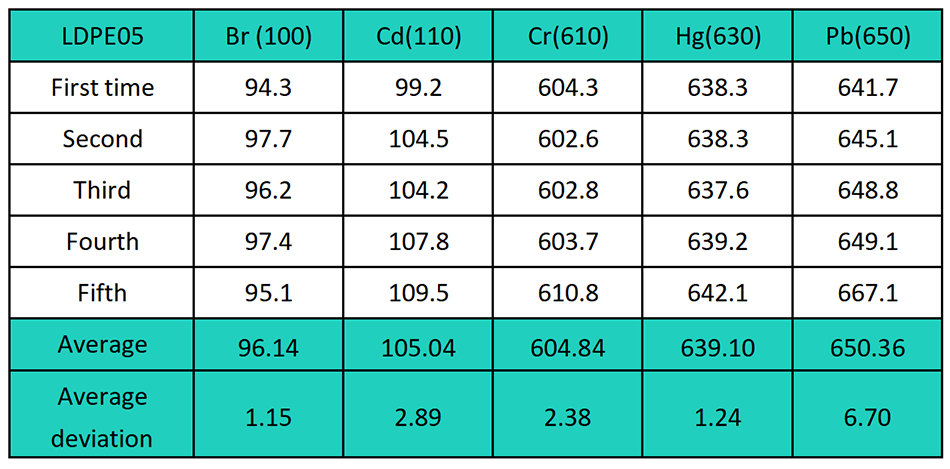
Average data from five test results:
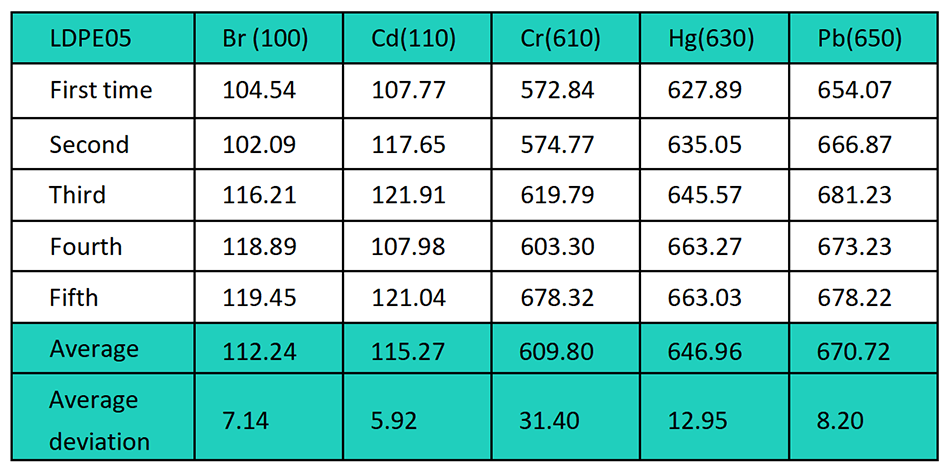
1.2 T6 (Influence Coefficients Method) test efficiency and reproducibility: (test time 60 seconds vs. 200 seconds)

Note:The green spectrum shape above is the 60 second test spectrum shape, the measured spectrum is the 200 second test spectrum shape.
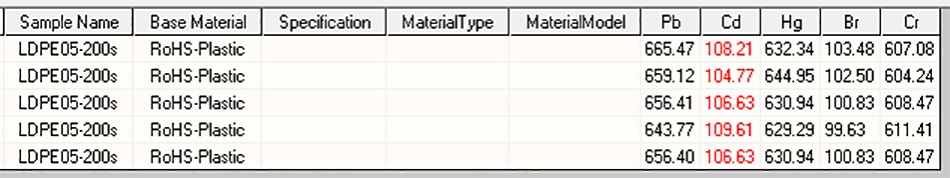
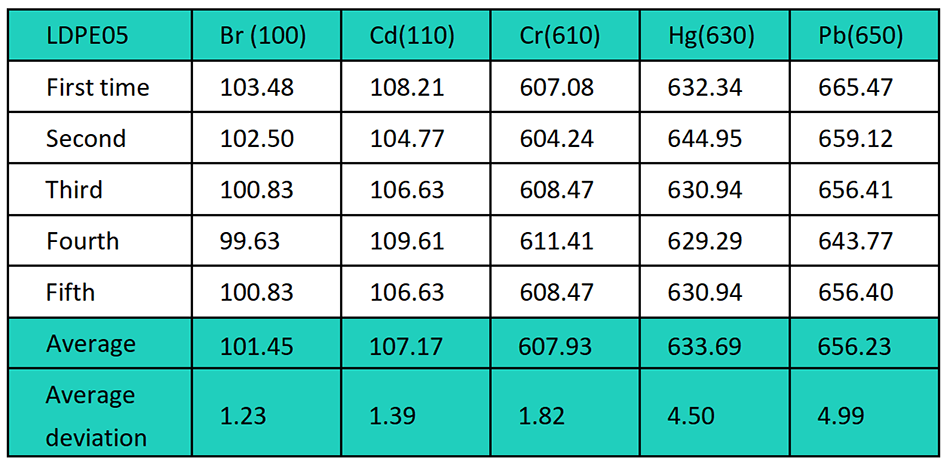
Data from five test results:
T6 60 second test results:
T6 200 second test results.
1.3 Comparison of deviations between the three groups of data: (the smaller the better)
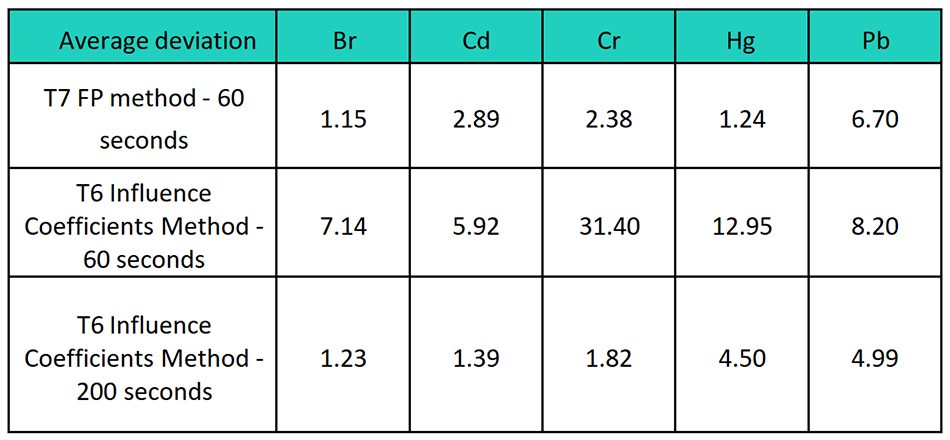
Conclusion: It can be seen according to the reproducibility of the FP method and the Influence Coefficients Method on test LDPE-05, the test data of the Influence Coefficients Method can reach the effect of the FP method test by extending the test time of 200 seconds when the specimen is back-tested, but the data difference is large at 60 seconds test.
The FP method produces accurate data while testing quickly.
2.Comparison of FP method and Influence Coefficients Method for complex samples
2.1 Non-metallic: a sample of a customer's colour powder as an example
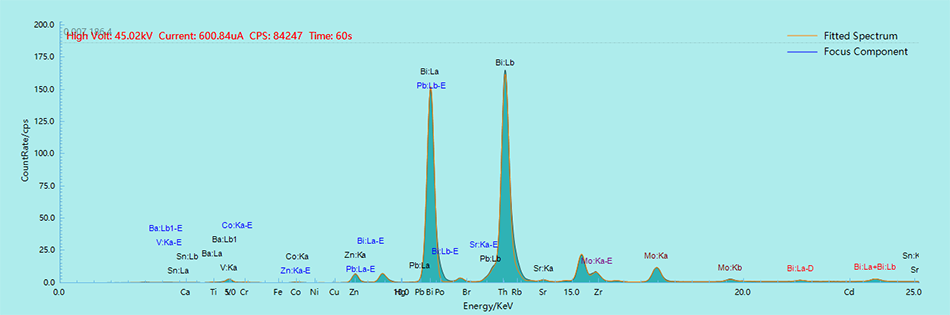
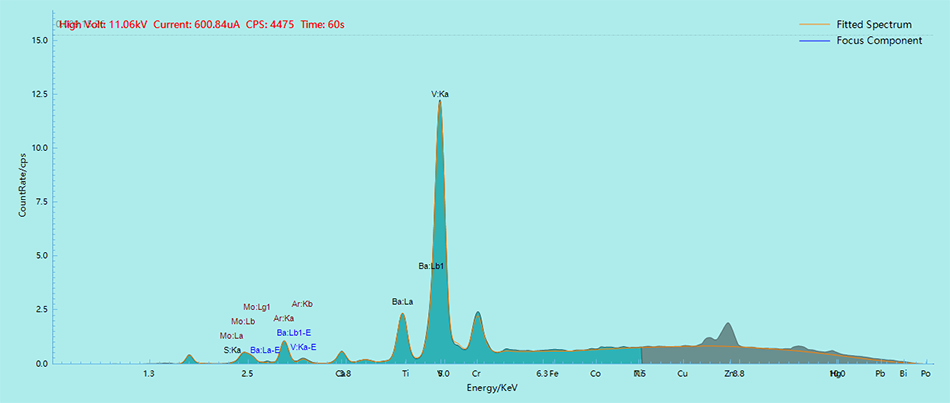
2.1.1 T7 (FP method) test
The spectrum shows that the sample contains the elements S, Ti, V and Bi;
Test results:

2.1.2 T6 (Influence Coefficients Method) Test
Test results:

2.1.3 Comparison of data from the two instruments
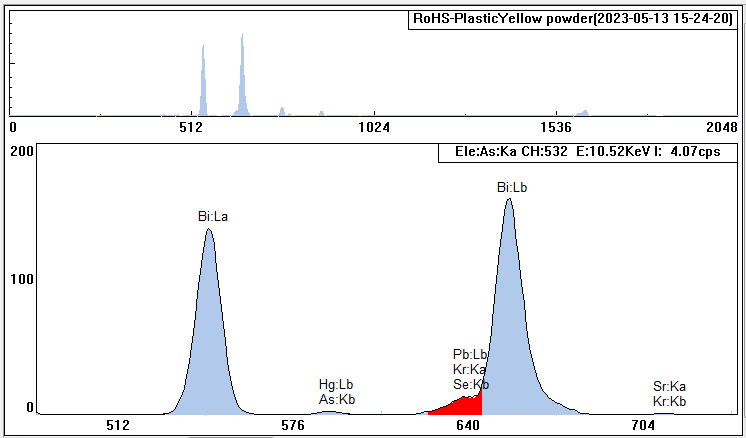
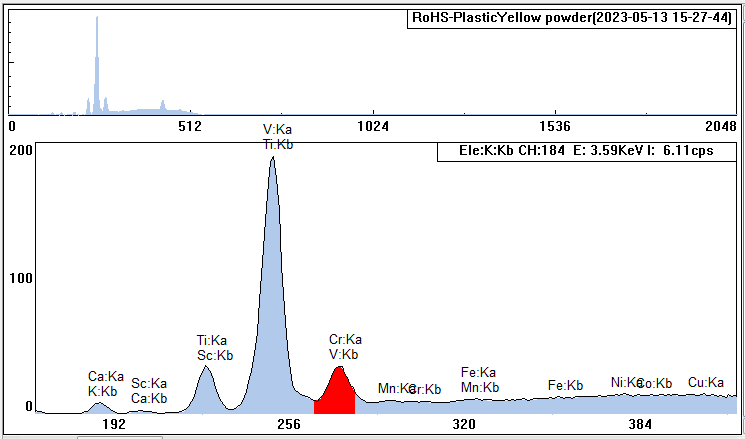
Due to the mutual interference when the sample contains a large amount of Ti or its compounds with Ka energy of 4.512 KeV, the escape peak of Ti element Ti:Ka-E energy of 2.772 KeV is close to the Cl element Cl:Ka energy of 2.622 KeV; V element V:kb energy of 5.42 KeV and Cr element Cr:Ka energy of 5.411 KeV, Pb element Pb:La energy of 10.55 KeV, Bi element Bi:La energy of 10.84 KeV, S element S:kb energy value of 2.468 KeV and Cl element Cl:Ka energy of 2.622 KeV there is mutual interference, will appear superposition of the phenomenon, the test result will be high, and the qualified sample may be tested over the limit.
Conclusion:When there are multiple mutual interfering elements in the sample, it is difficult to obtain correct results by T6 (Influence Coefficients Method), because it is difficult to accurately eliminate the influence of the mutual interfering elements even by decomposing the spectrum shape. However, T7 (FP method) can easily identify and distinguish the results because of the FP method based on sample structure modeling and full spectrum fitting, which can effectively decompose the mutual interference of each element.
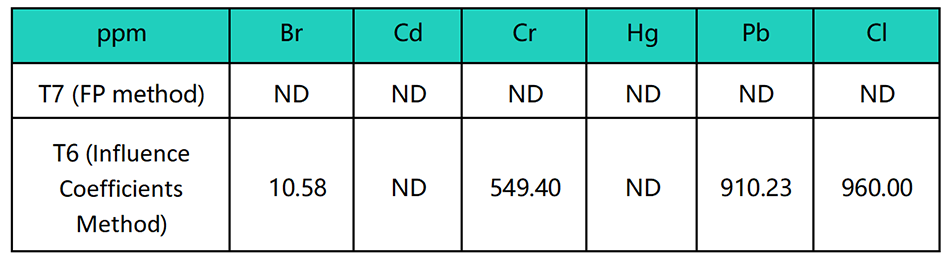
2.2 Metals: Example of a copper alloy sample from a customer
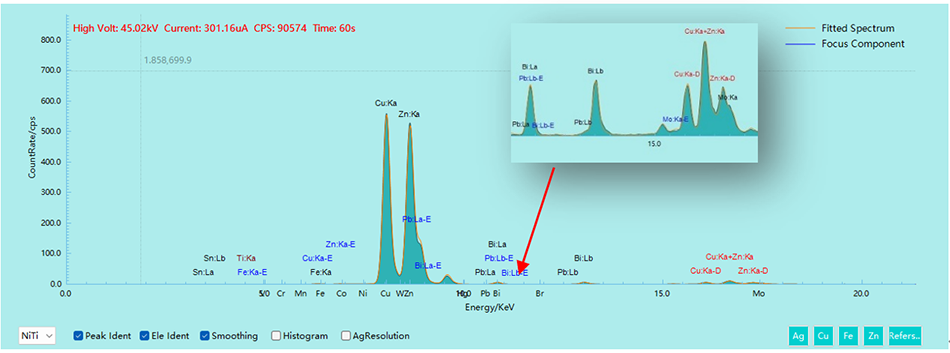
2.2.1 T7 (FP method) test
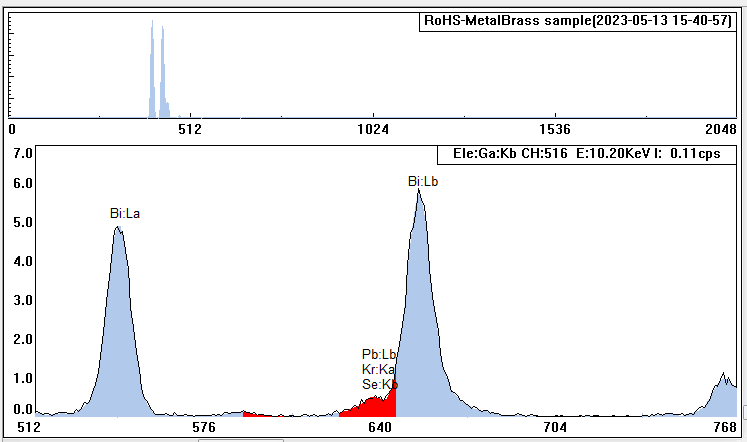
In the test spectrum, it can be observed that the sample is mainly a copper-zinc alloy, with the presence of Bi elements found upon local magnification of the spectrum;
T7 (FP method) test results:

2.2.2 T6 (Influence Coefficients Method) Test
T6 (Influence Coefficients Method) test results:

2.2.3 Comparison of data from the two instruments:
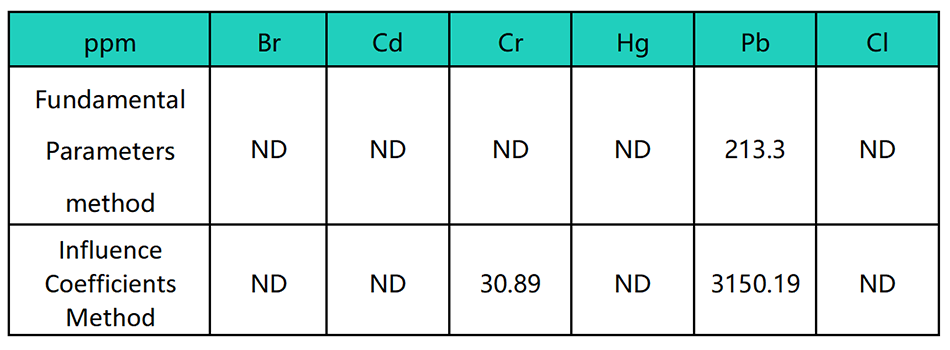
Conclusions: The testing of Pb on the T6 (Influence Coefficients Method) instrument mainly adopts Pb:La linear testing, the energy of Pb:La is 10.55KeV, Bi:La energy is 10.84KeV, the energy values are very close, there will be a situation though the Pb content is not high, it will result in its test results will be much higher because of the influence of Bi, which appears misjudgment. The T7 (FP method) instrument by establishing a sample model, while simulating and calculating the spectrum shape based on the excitation model of X-rays and the response model of the detector, and matching and fitting iterations with the actual measured spectrum shape to finally calculate the accurate content of the sample.
In summary, Influence Coefficients Method are prone to measurement bias when dealing with complex samples and require consideration of the complex nature of the sample and appropriate correction processes during the analysis process to obtain accurate analytical results. These problems can be solved by using the basic parametric method by building more accurate models to obtain more accurate analytical results.
3.Summary
In RoHS applications, the FP method (Fundamental Parameter Method) has significant advantages compared to the influence coefficient method. First, the FP algorithm significantly reduces the calculation time and greatly improves the testing efficiency; second, even without a standard sample, the elemental content of the sample can be quantified relatively accurately; third, for some samples with complex components and mutual interference of elements, the FP method can also be a good solution, this has absolute advantages over the traditional Influence Coefficients Method.

